
System Resources in SAP Integration Suite – Cloud Foundry Environment
Isuru Fernando ·

When you start working with SAP Integration Suite, it feels like everything just runs in the background. You build your iFlows, deploy them, and move on.
But under the hood, the system is always watching resources. And once you hit a limit, you notice it quickly.
So instead of thinking about this as “theory”, it helps to understand one simple thing: Every integration you build consumes a shared pool of system resources.
If you manage them well, everything runs smoothly. If you don’t, you eventually run into errors like storage issues, stuck messages, or failed deployments.
Let’s break it down.
SAP Cloud Integration Storage
1. Integration Content Size
This is basically all your deployed artifacts. iFlows, mappings, scripts, APIs, everything.
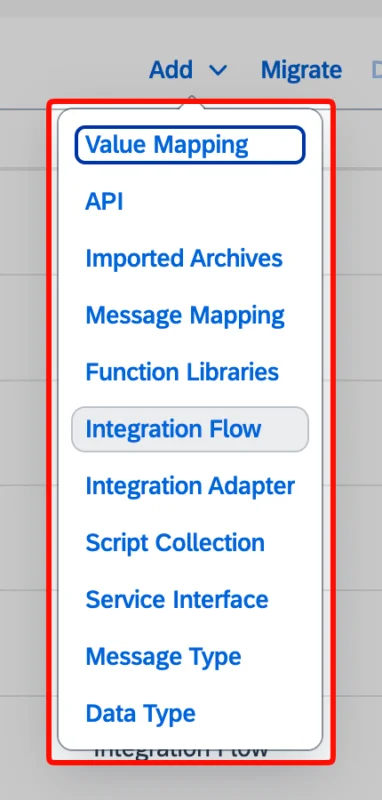
In Cloud Foundry, you get around 2 GB of content storage.
In real projects, this is what I have seen happen:
- You deploy multiple versions of the same iFlow
- You keep old ones “just in case”
- You build “test artifacts” and forget to delete them
Over time, it adds up. Nothing breaks immediately. But at some point, you start seeing deployment issues or warnings.
What helps here is not complicated:
- Clean up old artifacts
- Avoid keeping duplicate versions in the same tenant
- Treat the tenant like a shared workspace, not a local dev folder
2. JMS queues and Messaging Resources
JMS is what you use for async processing, retries, and decoupling systems. JMS queues is a great method to asynchronously decouple interfaces.
Default setup gives you:
- Around 9 GB JMS capacity
- 30 queues
- 150 transactions
And it can be scaled up to:
- 30 GB capacity
- 100 queues
- 500 transactions
How to View the Size of Current Queues
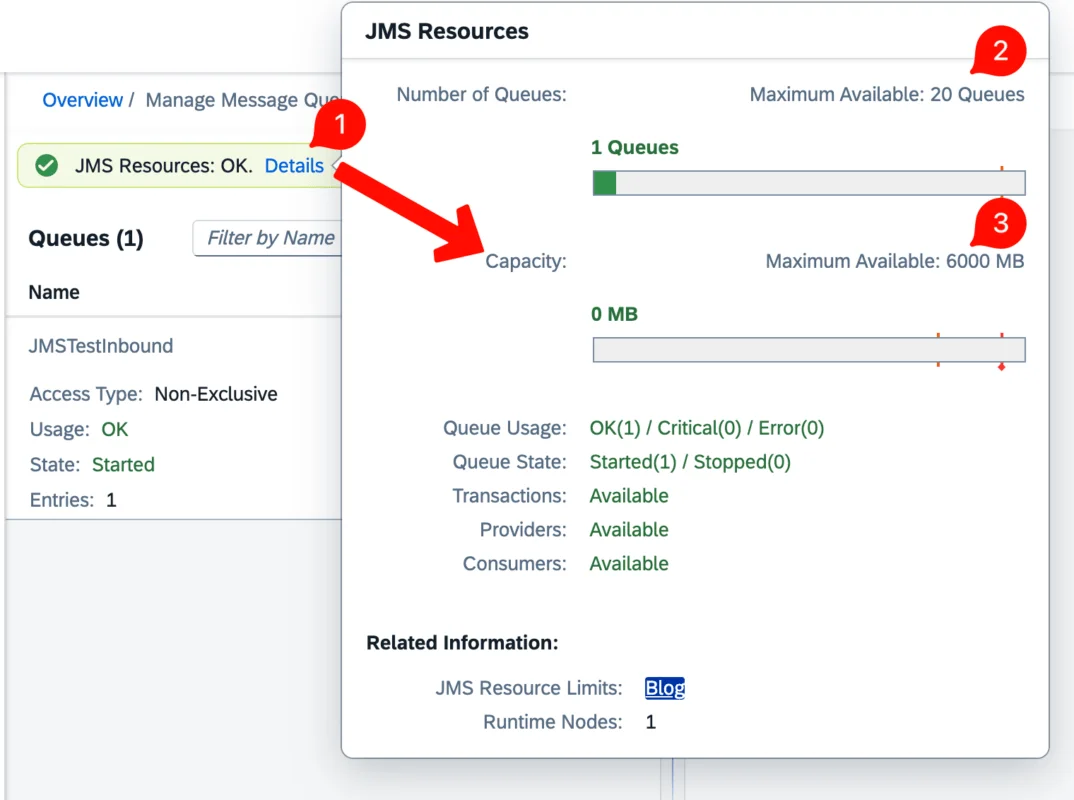
Go to the monitor “Manage Message Queues” and use the option “Details” under JMS ques to see the current volume of queues in your system.
Why does my system show the maximum number of queues as 20? It is a screenshot from an SAP Integration Suite trial system.
How JMS Queues are Created in SAP Integration Suite
Now the important part.
Queues don’t disappear automatically, nor can you create them manually. You have to deploy the iFlow to create queues. If you create them through iFlows and later remove the interface, the queue can still remain.
That’s where most teams lose control.
What you typically see in real systems:
- Old queues from finished projects are still active
- Test queues created are never deleted after testing
- Messages are stuck because the backend is down
- Using queues for all scenarios without any design guidelines or governance
A simple habit helps a lot:
- Have a good guideline on when to use queues and when not to use queues
- Have an integration governance and guideline for when queues must be used
- Review queues regularly and delete the test queues
- Delete what is no longer used by iFlows
- Watch for message buildup early
3. Message Processing Logs
Logs are one of the biggest silent consumers of storage.
What Is Included in the Processing Log
Processing Logs are detailed runtime records that show how a message is processed inside a flow. Payload snapshots (input/output at different stages, if enabled), errors, warnings, and exception details if something fails, and timestamps and execution duration for each processing step are some of the information saved in the processing log.
SAP gives you around 35 GB for message processing logs.
Processing log Trace Levels
Trace levels define how much runtime detail is captured for message processing. None disables tracing completely for best performance. Error captures only failures and exceptions. Info provides basic execution details like message flow steps and key events. Debug records deeper technical information, including step-by-step execution data. Trace is the most detailed level, logging payloads and internal processing at nearly every step, and is mainly used for in-depth troubleshooting due to its performance impact.
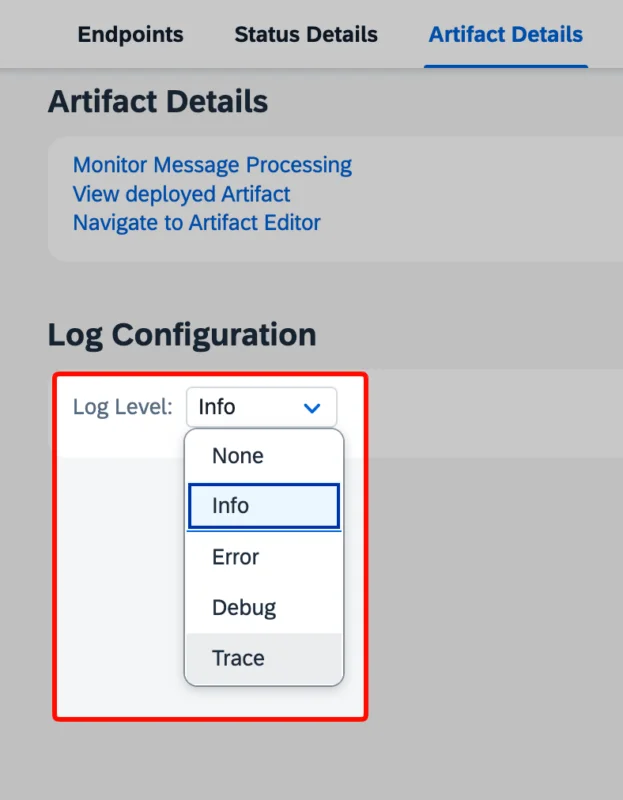
During development, everyone turns on trace or debug. That’s normal. The issue is what happens after go-live. If you forget to reduce log levels, you end up storing far more than you need. And it grows fast in high-volume interfaces.
In most projects I’ve seen, this is one of the first things that causes storage pressure.
Keep it simple:
- Use Trace only when debugging
- Keep production on normal or error level
- Don’t treat logs as long-term storage
You can also define a trace level matrix based on the priority of the interface, based on your organizational needs.
4. Runtime Database and Data Stores
This is where SAP stores runtime data like:
- Data Store entries
- Aggregation data
- Variables
- Message-related temporary data
The limit here is also around 35 GB .
This part usually gets ignored until something breaks. The common issue is not design but cleanup.
People store data but don’t define:
- Retention rules
- Cleanup logic
- Expiry strategy
So the data just stays there. If you use Data Stores, always ask one question:
“How and when does this get cleaned up?”
If there’s no answer, you’ll see growth over time.
5. Disk Space
Disk space is the one that usually surprises teams.
You get around 10 GB per tenant.
It’s used for:
- Temporary files
- Payload processing
- Attachments
- Internal processing artifacts
Most issues here come from large files or poor cleanup logic.
A typical real-world scenario:
A file processing flow writes temporary data, but never deletes it, and slowly, the disk fills up. Nothing dramatic. No warning. Then suddenly, deployments fail.
Rule of thumb: If you create temporary data, you should also delete it.
How to think about all this
You don’t need to monitor every byte daily. That’s not realistic.
But you should have a few basic habits:
- Clean up old integration artifacts
- Remove unused JMS queues
- Keep logging under control
- Define retention for stored data
- Avoid unnecessary persistence
Most production issues I’ve seen in Integration Suite are not design problems.
They’re cleanup problems. Or not having a clear definition of how to use queues, what Trace levels to use, and other integration guidelines.
Final Thought on System Capacity
SAP Integration Suite gives you a solid platform. But it’s still a shared system with limits.
Once you understand where those limits are – content, JMS, logs, runtime data, and disk – you can plan to use them in the correct way based on your organization’s needs. And if you keep things clean, the system stays predictable.
Also, define the use cases of JMS queues, Log Levels, etc and have it well documented in the integration guideline. Make sure developers stick to the guidelines as well as clean up the test objects.